Fishbone Diagram: Technique for Root-Cause Analysis
Published by Pavel Nakonechnyy on in Business Analysis.Fishbone diagrams, also known as Ishikawa or cause-and-effect diagrams, are powerful tools used in root-cause analysis to visually decompose problems into their components. This technique helps teams identify, analyze, and represent the underlying causes of a problem, making it easier to find effective solutions.
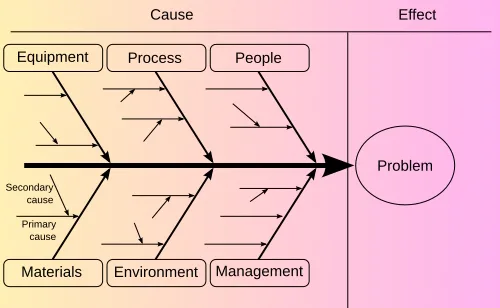

The head of the fish represents the problem being addressed. The main bones are the major categories of possible root causes, and the smaller bones represent the cascading and drilling down of possible root causes. Typically, a fishbone diagram will have 4-6 main bones representing the major causes of what you are analyzing, such as:
- The four Ms: Methods, Machines, Materials, Manpower.
- The six Ms: Manufacturing (technology), Method, Material, Manpower/ Mindpower, Measurement, Mother Nature (environmental factors). This is especially useful in a manufacturing context.
- The four Ps: Place, Procedures, People, Policies.
- The six Ps: Place, Procedures, People, Policies, Product/Service, Physical evidence.
- The four Ss: Surroundings, Suppliers, Systems, Skills.
The marketing industry uses an extended version of the six Ps: Product/Service, Price, Place, Promotion, People, Processes, Physical Evidence and Productivity; and in the service industries, they add ‘Safety’ to the four Ss.
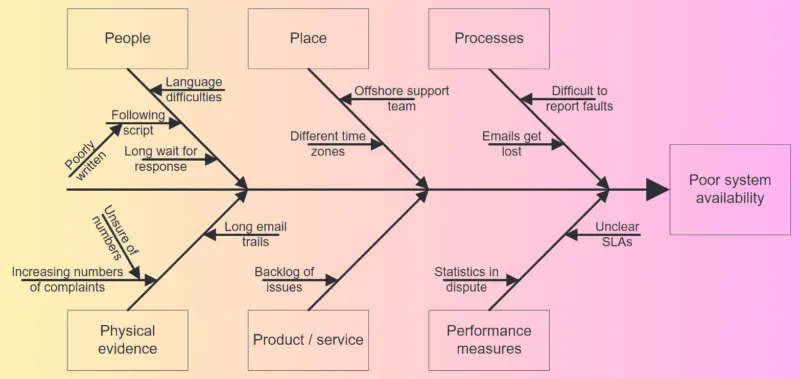

Once the diagram has been constructed, further work can be done to investigate the issues identified and to find the most likely, or most significant; one approach to this is to look for common factors in the various categories. For instance, in our example, the difficulty of reporting faults, the loss of emails and the long wait for a response seem to be related. This, in turn, helps to prioritise the issues that should be tackled first to bring about a solution.
BAs also need to be careful to distinguish between what Edward de Bono has called ‘checked facts’ and ‘believed facts’. The former are things that can be proved by examining relevant records, but the latter are what ‘everyone knows’. Opinions may be based on verifiable facts but they may just reflect prejudices and preconceptions and, if so, relying on them during cause-and-effect analysis can lead to wrong conclusions being drawn and ineffective solutions being proposed.
Benefits of Using Fishbone Diagrams
Fishbone diagrams offer visual clarity by mapping various causes of an issue and making links between them that might otherwise be overlooked. By breaking down the contributors to any process or system, fishbone diagrams help teams tackle smaller chunks that have a large impact on the problem.
Business analysts can use fishbone diagrams to document what they have found after a series of interviews. Alternatively, they are an ideal technique to use within a workshop. The basic diagram can be set up on a whiteboard and the issues recorded on sticky notes as they are discovered.
Effective Problem-Solving
Fishbone diagrams help distinguish the causes and reasons for a problem, allowing people to intuitively figure out solutions. This method is particularly useful in troubleshooting processes, investigating product failures, exploring customer complaints, and brainstorming quality improvements.
Fishbone diagrams are an essential tool in the problem-solving arsenal, providing a structured and visual approach to root-cause analysis. By breaking down complex problems into manageable components, teams can efficiently identify and address the underlying causes, leading to effective solutions and continuous improvement. Whether in manufacturing, marketing, or energy sectors, fishbone diagrams offer a versatile and proven method for enhancing quality and performance across various industries.